
Some of the products on this page come from partners who may compensate us when you click on their links or take specific actions. This helps us keep our content free. That said, our opinions are our own and based on independent analysis.
It’s no secret that Americans love their pets. According to recent statistics, approximately 69 million households own a dog, 45 million have a cat, and almost 12 million own a fish.
The trend of becoming pet “parents” surged during the COVID-19 pandemic, with 23 million households (nearly 1 in 5 nationwide) adopting a pet. To understand the extent of this devotion, we surveyed American pet owners to find out just how much they spoil their pets.
United States of Pets
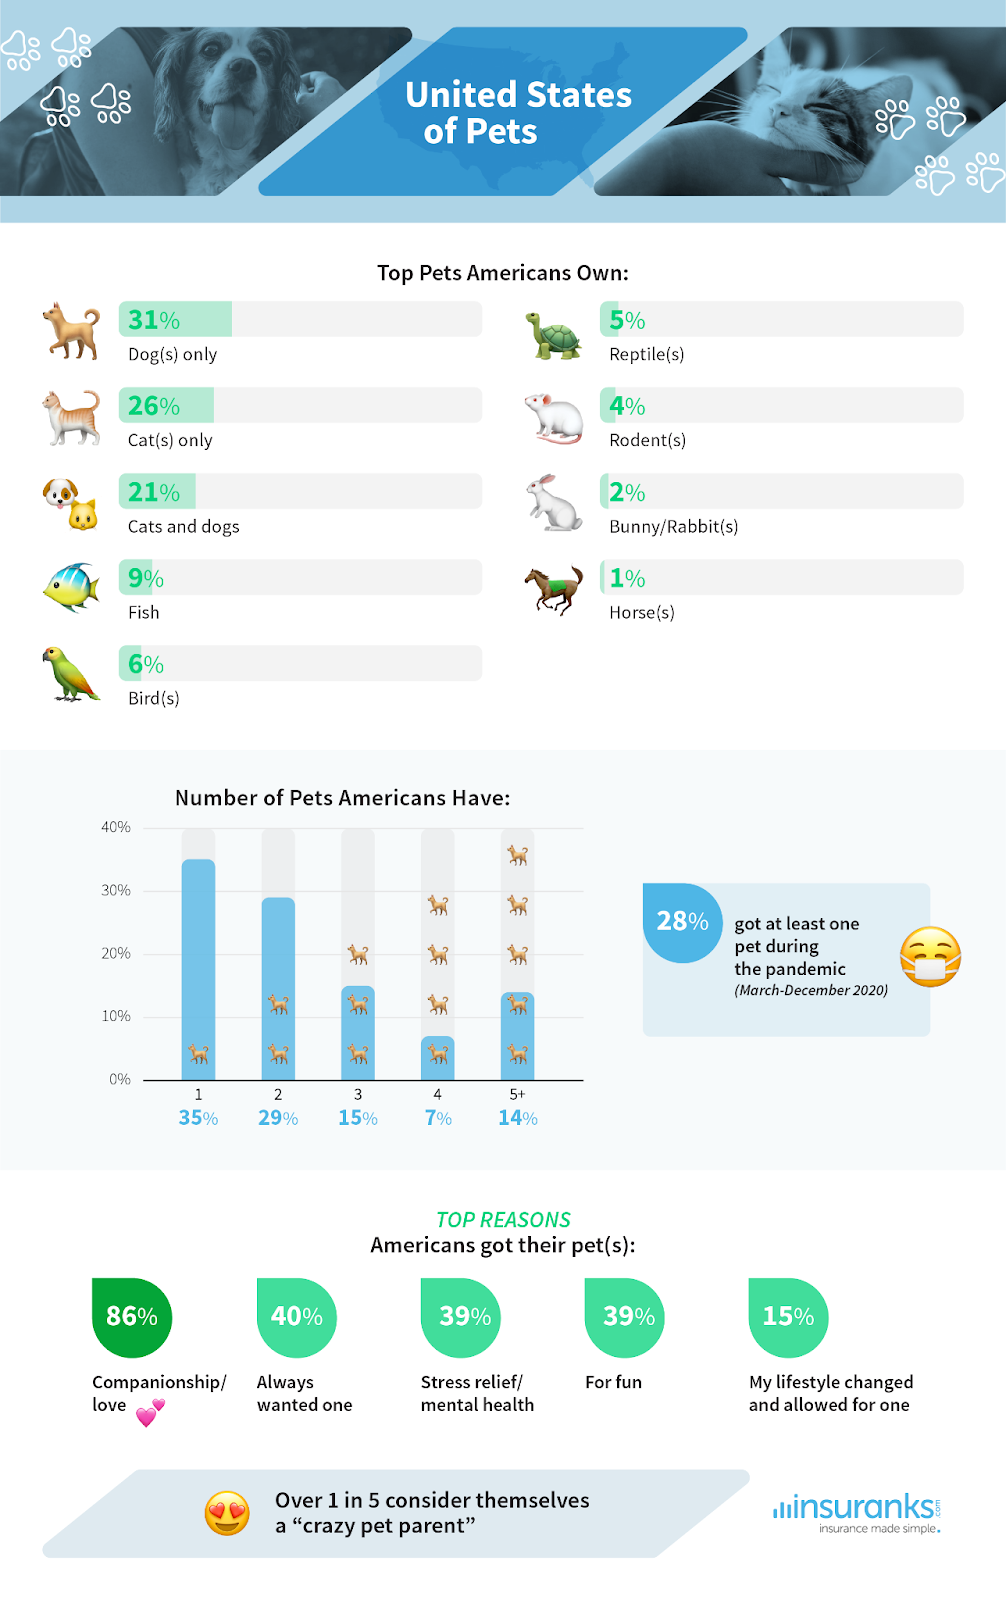
Most pet owners (31%) have dogs, and just over 1 in 4 (26%) only have cats. One in five American pet owners (21%) have both cats and dogs. Other popular pets include fish (9%), birds (6%), reptiles (5%), rodents (4%), bunnies/rabbits (2%), and horses (1%).
Most (35%) of American pet owners have just one pet. Almost one in three (29%) have two pets, and the rest have three or more. In fact, 15% have five or more pets, which might be considered a small zoo!
The COVID-19 pandemic allowed many who always wanted a pet the opportunity to get one, thanks to more flexible work arrangements and the ability to move to more spacious homes. With lockdowns between March 2020 and December 2020 leaving many Americans lonely, our survey found that 28% of pet owners adopted at least one of their pets during this time period.
When asked why Americans got their pet or pets, the top reason was for companionship and love (86%), followed by always wanting one (40%), for their mental health (39%), and fun (39%). Nearly one in six (15%) mentioned they were able to get a pet because their lifestyle changed.
With great pets comes great responsibility. Americans are taking it seriously – over 1 in 5 American pet owners consider themselves a “crazy pet parent.”
Pet $pending
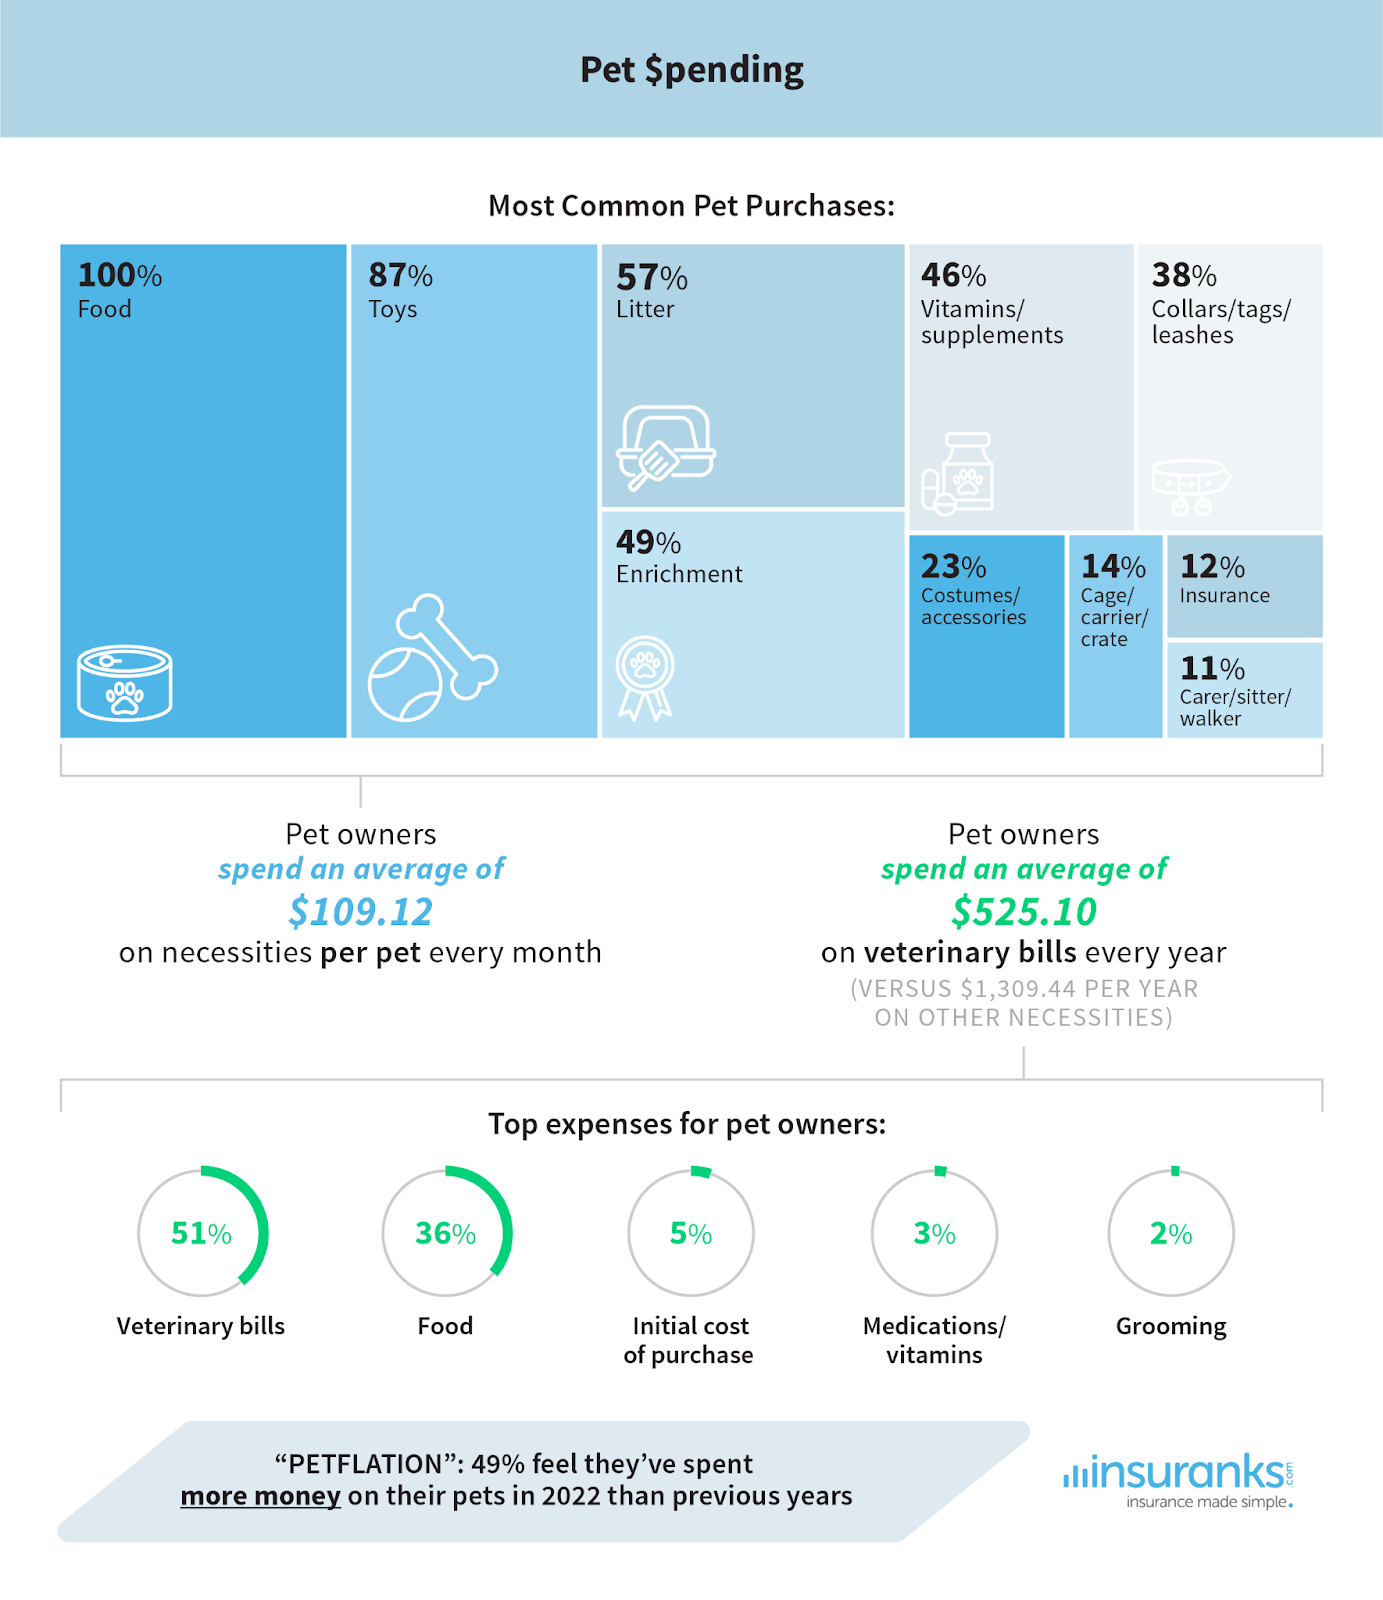
Pets aren’t all fun and games – they can also be expensive. When it comes to necessities, the most common things Americans buy for their pets are food (100%), toys (87%), litter (57%), enrichment items (49%), and vitamins/supplements (46%). Other expenses include collars, tags, and leashes (38%), costumes and accessories (23%), carriers and crates (14%), insurance (12%), and a caregiver, sitter, or walker (11%).
According to our survey, pet owners spend an average of $109.12 on these necessities per pet every month. That’s about $1,309.44 each year – which can quickly add up! Additionally, pet owners spend an average of $525.10 annually on veterinary bills per pet. In total, that’s almost $2,000 a year per pet on necessities and healthcare!
When asked about the top expenses for their pets, owners cited veterinary bills (51%) as the highest, followed by food (36%), the initial cost of purchasing the pet (5%), medications and vitamins (3%), and grooming (2%).
It feels like the cost of everything has gone up – and pet supplies are no exception. Almost half (49%) of pet owners feel they’ve spent more money on their pets in 2024 than in previous years.
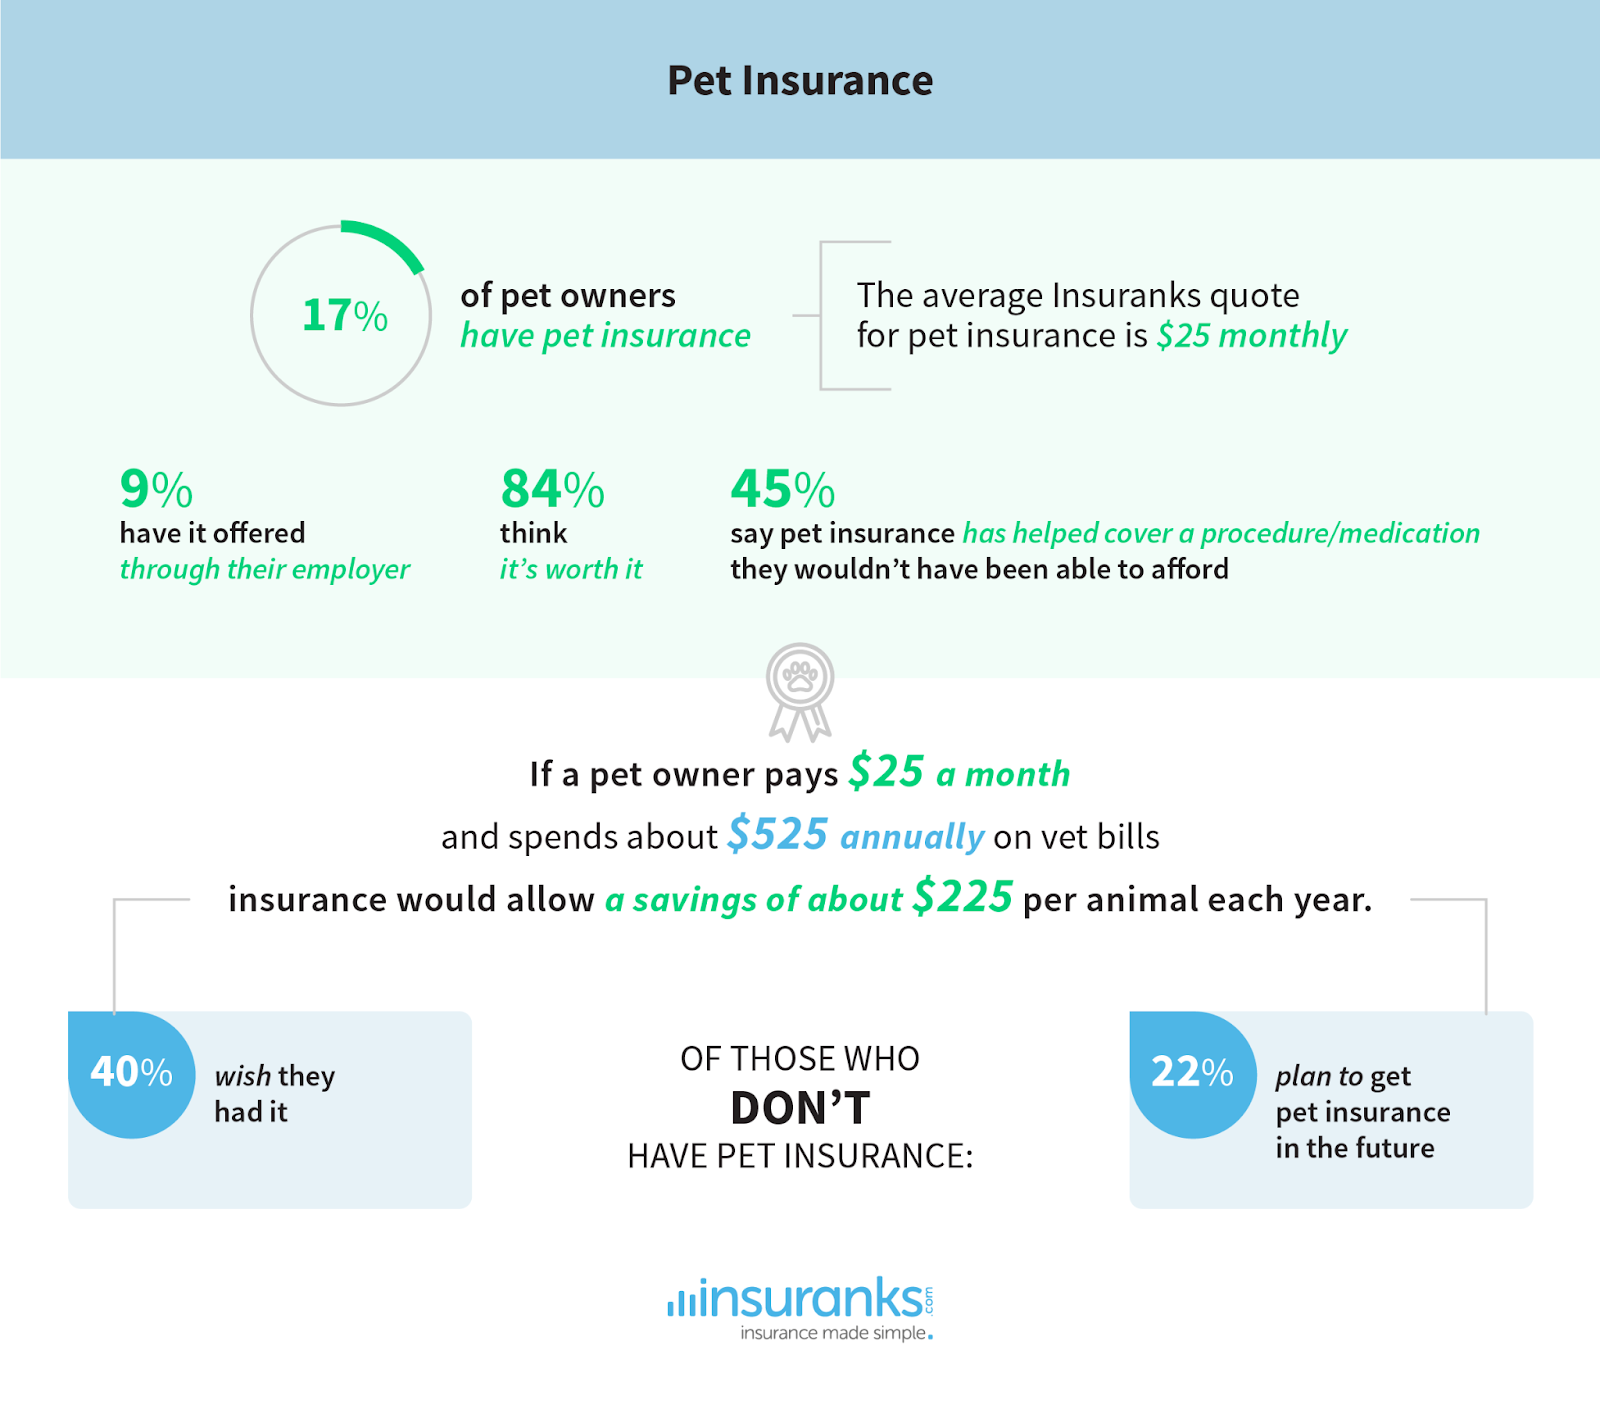
How Much Do Pet Owners Pay for Pet Insurance?
Veterinary bills and medicine can be especially expensive for our furry friends. The popularity as well as necessity of pet insurance is on the rise, with more and more employers offering pet insurance to employees as part of their incentive packages.
While pet owners may be spending more than $525 annually on vet bills per animal, pet insurance can help save a lot of money. For comparison, the average monthly per insurance quote on Insuranks is $25. Assuming this is the pet insurance coverage that pet owners have, and given that their spending is about $525 annually on vet bills, pet insurance would allow a savings of about $225 per pet each year!
According to our report, currently only 17% of pet owners have pet insurance, with most of those with insurance agree that it’s worth it and saves them money and recommend it to others. Almost half (45%) say pet insurance has helped cover a procedure or medication they wouldn’t have been able to afford otherwise…
Among those pet owners who don’t have pet insurance, 40% wish they did, and 22% plan to get pet insurance sometime in the future.
Given these findings, it is safe to say that every pet owner would be wise to get pet insurance, since the cost is fairly low, and the savings are fairly high.
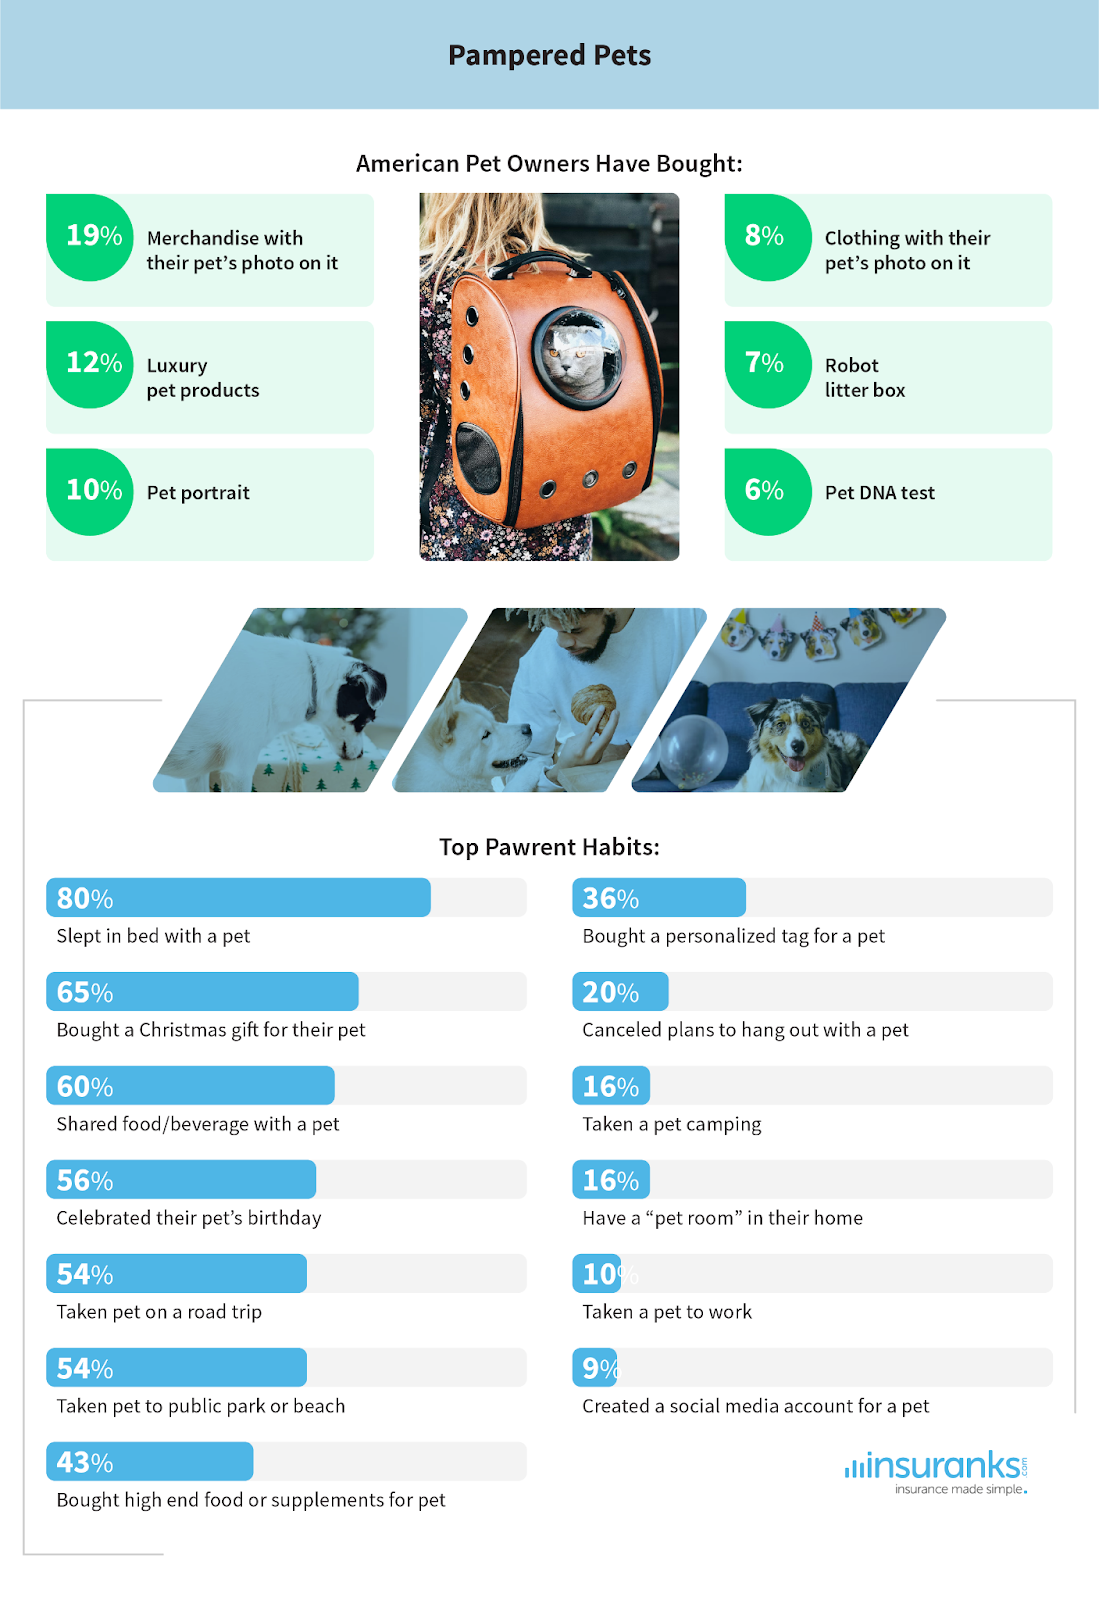
Pampered Pet
4o
In June 2024, we surveyed 500 American pet owners on their expenses and ownership habits. Respondents were 18 to 75 years old, with an average age of 40. Respondents were 49% male, 50% female, and 1% transgender/non-binary.
For media inquiries, please contact media@digitalthirdcoast.net.
Fair Use
When using this data and research, please attribute it by linking it to this study and citing https://www.insuranks.com/.